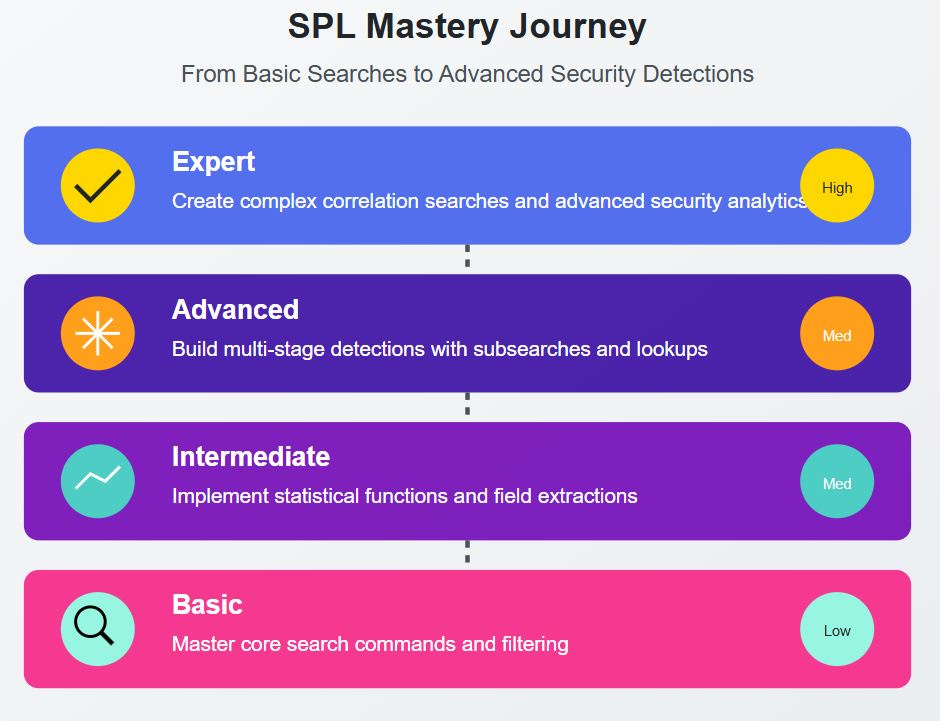
A Step-By-Step guide for Mastering Splunk's Search Processing Language
So you can focus on what matters - building better threat detections and incident response capabilities in Splunk
Hey Splunkers,
Splunk’s greatest strength is also it’s greatest weakness - the sheer complexity and sophistication of the tool itself.
Picture this: I'm sitting at my desk during my time in the Navy on a cyber defense team, staring at a Splunk search bar with a severe case of blank screen syndrome. We had virtually unlimited Splunk licensing but zero training on how to use it effectively. Our team was copying and pasting queries from documentation, hoping they'd catch something important.
Spoiler alert - it wasn’t a winning strategy.
90% of security teams are barely scratching the surface of what Splunk can do, and it's leaving their organizations vulnerable to threats.
Fast forward through years of grinding post Navy – Splunk certifications, consulting gigs, and countless customer deployments as a Splunk professional services consultant, and I was starting to feel like I was getting a solid grasp on SPL. But my real breakthrough? It came from building an enterprise monitoring suite for Web3 infrastructure in AWS. That's when everything clicked and my SPL skills really took off.
It took me way too long to get a solid grasp on SPL, but that’s why I’m writing this newsletter - so you can learn it exponentially faster than I did.
Today, I'm sharing the exact system I used to go from SPL novice to writing detection content that protects billions in assets. Here's what you'll learn:
A step-by-step blueprint for mastering Splunk's query language (even if you're starting from zero)
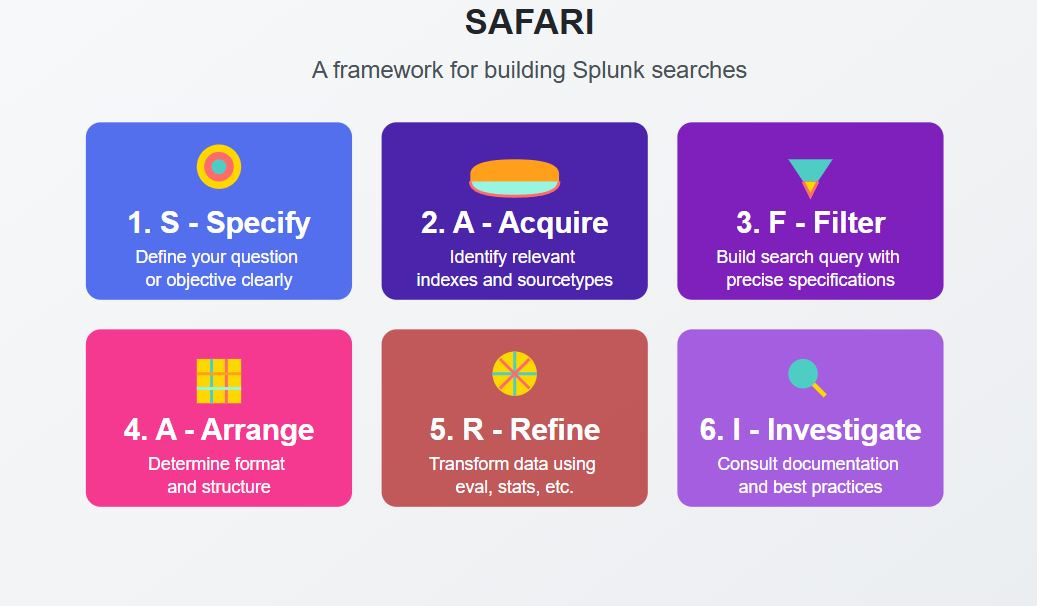
My SPL framework (SAFARI) that helps guide users to building effective searches
Advanced techniques that turn good analysts into irreplaceable threat detection engineers
Let's start with the basics...
The 8-Step System for Splunk SPL Expertise
Envision wielding the power to uncover hidden threats, automate critical security workflows, and resolve incidents at unparalleled speed.
That's the reality SPL unlocks - if you know how to utilize it effectively.
Here's the issue: Most beginners take the wrong approach.
They jump straight into complex queries or security content without first establishing core skills. The result?
Frustration
Inefficiency
Limited proficiency.
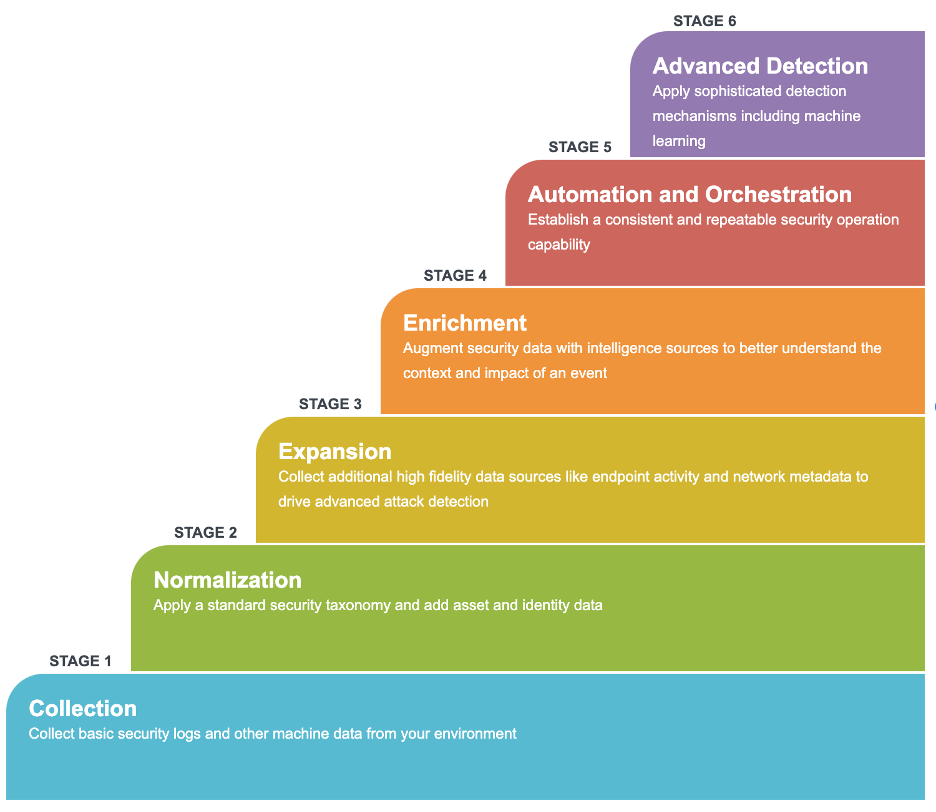
And an overall Splunk maturity level that hovers around Stage 2 and 3, never really getting to the good stuff.
But with over 8 years of working with Splunk and grinding away, I've developed a step by step system to help security analysts go from zero to hero in no time.
As with anything, it all starts with mastering the fundamentals first.
Step 1: SPL Building Blocks - Mastering the Essentials
Understanding Host, Source, and Sourcetypes
Virtually every search you build will need to reference one of these three, so it’s important to understand the difference.
Host: The name of the physical or virtual device that generated the event
Source: The name of the file, stream, or API that provided the event data to Splunk
Sourcetype: Identifies the data structure of an event, used for parsing and field extraction
Searching: Retrieving Relevant Data
SPL queries start with a search command to retrieve an initial set of events. Key components include:
Selecting specific indexes or sourcetypes
Filtering events based on field values
Using Boolean operators (AND, OR, NOT) for complex criteria
Specifying time ranges for targeted analysis
Example:
index=web sourcetype=access_combined status!=200 user=*Manipulating Time
There are two primary ways to specify time ranges in Splunk searches:
Time picker: Select a preset time range (e.g. Last 24 hours) or custom range in the search view.
Inline modifiers: Add time specifiers directly in the search.
Latest/Earliest:
index=web earliest=-7d@d latest=-1d@dRelative:
index=web -7d@d to -1d@dReal-time:
index=web -15m
These options provide flexibility for scoping searches to specific time windows.
The Pipeline Paradigm
At its core, SPL is a data processing pipeline. Each command in the pipeline:
Takes the results of the previous command as input
Performs a specific operation on that data
Passes the transformed data to the next command
This linear flow is the heart of SPL. Grasping it is crucial for constructing effective queries.
Left-to-Right Processing
SPL queries are read and executed from left to right.
The initial search command retrieves data, and each subsequent command operates on the results of the previous step. Example:
index=linux sourcetype=access_* status=200 | top limit=10 clientip | fields clientip, countSearch: Retrieves events with sourcetype access_* and status 200
Top: Finds top 10 clientip values by count
Fields: Retains only clientip and count fields
Understanding this left-to-right flow is key to building logically sequenced queries.
Pipes: The Transformation Conduit
The pipe character (|) is the connector between SPL commands.
It takes the results from one command and "pipes" them into the next. Think of pipes as the conduits in the data pipeline. They don't modify the data themselves but rather transport it between transformation steps.
Proper use of pipes ensures a smooth flow of data through the query pipeline.
Fields: Accessing Event Data
Fields are the named pieces of data within events. SPL provides commands for working with fields:
Extracting fields from unstructured data
Renaming or removing fields
Performing calculations and comparisons on field values
Grouping results by field for aggregation
Example:
| index=...
| fields _time index response_time
| eval response_time = response_sec / 60
| rename response_time AS response_min
| table _time index response_min
Transforming Results
SPL offers a rich set of commands for transforming query results:
Filtering and deduplicating events
Calculating aggregate statistics
Reshaping data structure with join, append, transpose
Applying mathematical and string manipulations
Example:
| index=...
| stats avg(bytes) AS avg_size BY clientip | eval mb_size = round(avg_size / 1024 / 1024, 2)
Visualizing Insights
Effective SPL queries culminate in clear data visualization for actionable insights:
Generating charts, timelines, and tables
Applying statistical functions for trend analysis
Building dashboards for real-time monitoring
Customizing colors, labels, and formatting for clarity
Example:
|index=...
| timechart span=1h count BY status usenull=f
Tying It All Together
Mastering these fundamental concepts empowers you to construct potent SPL queries for diving deep into your data. As you advance, leverage SPL's extensive command set and pipelining capabilities to tackle increasingly sophisticated analysis challenges.
The key to SPL proficiency lies in:
Understanding the pipeline paradigm
Retrieving relevant data with targeted searches
Accessing and manipulating fields effectively
Applying transformations for shaping results
Visualizing data for clear, actionable insights
Embrace the building blocks of SPL, and you'll be well on your way to unlocking the full potential of your machine data.
Pro Tip: To auto format your SPL in the search bar, type in “CTRL + \”.
Step 2: Starting Simple - Building SPL Confidence
Begin with basic queries to build understanding. A simple first command:
index=main sourcetype=access_combined
| stats count by status
This searches the 'main' index for events with sourcetype 'access_combined' and counts them by status field.
Key tips:
Be specific in the search with index, sourcetype/source, and fields
Avoid searching all indexes (
index=*) in production - resource intensiveThink like an investigator - identify the question, then build the query
Walk before running - start simple, then gradually add complexity
Example thought process:
What question am I answering? (e.g., How many requests had each HTTP status?)
What data do I need? (web access logs)
Where is that data? (index=main, sourcetype=access_combined)
How do I want it summarized? (count by status)
By breaking it down and being specific, you construct targeted queries that run efficiently and return relevant results. As you gain confidence, layer in additional filters, fields, and transformations to extract deeper insights.
Here's a framework that I developed to guide your SPL learning journey - SAFARI:
Specify: Clearly define the question or objective you want to address.
Acquire: Identify and locate the relevant index(es) and sourcetypes containing the necessary data.
Filter: Build your search query, precisely specifying the index, sourcetype, and time range to narrow down the data.
Arrange: Determine the desired format and structure of the data for your alert or search.
Refine: Utilize commands such as eval, stats, or others to transform and refine the data according to your requirements.
Investigate: Consult Splunk documentation, AI tools, or the community for guidance on advanced formatting techniques and best practices.
The key is a methodical approach - identify requirements, locate data, start focused, and expand gradually.
This builds a strong SPL foundation for tackling more complex challenges.
Step 3: Mastering Data Manipulation - Eval and Stats
Once you have mastered the fundamentals of Splunk search, it’s time to start slicing and dicing your data.
This is where things start to get a bit fun. Between both eval and stats commands, in my experience, this covers roughly 90% of my SPL needs. The rest of the commands you might use in a typical search are highly situational, such as manipulating multi-value fields, or regex field extraction.
Eval: Transforming Data on the Fly
The eval command is your Swiss Army knife for on-the-fly data transformation.
It allows you to perform calculations, convert data types, extract information, and add fields based on conditions. Mastering eval unlocks limitless potential for sculpting data to suit your needs.
Some common use cases:
Extracting date/time components:
| eval hour=strftime(_time, "%H"), month=strftime(_time, "%m")Calculating ratios and percentages:
| eval ratio=round(success/total, 3), percent=success/total*100Conditional field creation:
| eval risk=if(failed_logins>5 AND off_hours="yes", "high", "low")Stats: Summarizing and Aggregating
While eval operates on each event, stats works across result sets to generate summary statistics.
It's the go-to command for aggregations, groupings, and identifying patterns across your data.
Common stats functions:
count: Number of events
distinct_count (dc): Number of unique values
avg/min/max/sum: Numeric field statistics
list/values: Collecting field values into a list
stdev/variance (var): Measuring data dispersion
Example:
index=apps
| stats count avg(duration) as avg_dur by user, application
| eventstats avg(avg_dur) as global_avg
| eval deviation=round((avg_dur - global_avg)/60, 2)
This query calculates average duration per user/application, compares to the global average, and computes deviations in minutes.
Combining Eval and Stats
The real power emerges when eval and stats join forces.
You can aggregate data with stats, then further manipulate with eval for insightful analysis.
Let's revisit our earlier example:
index=security sourcetype=windows_security EventCode=4625
| eval login_hour=strftime(_time, "%H")
| stats count by login_hour
| eval is_business_hours=if(login_hour >= 9 AND login_hour <= 17, "yes", "no"), hour_group=case( login_hour >= 0 AND login_hour < 6, "Late Night", login_hour >= 6 AND login_hour < 12, "Morning", login_hour >= 12 AND login_hour < 18, "Afternoon", true(), "Evening")
| stats sum(count) as total_failed_logins by is_business_hours, hour_group
We've expanded the original query to:
Add an hour_group field for clearer time buckets
Aggregate failed logins by business hours and hour group
The result is a powerful summary of failed logins segmented by meaningful time categories - perfect for identifying suspicious off-hours activity. I highly recommend spending a decent chunk of time with just these two commands.
Once you’ve mastered eval and stats, it’s time to level up again - this time with some advanced Splunk SPL capabilities.
Step 4 - Leveling Up Your SPL Game: Advanced Optimization Techniques
While an entire book could be written about the following two Splunk capabilities - datamodels and tstats, here’s the 30,000 ft. view.
tstats: Turbocharging Data Retrieval
The tstats command is a game-changer for query efficiency.
Normal Splunk queries (as you’ve been seeing above) have to slog through the raw data stored in indexes, looking for matches and returning results. It’s not efficient in the slightest and in large Splunk environments, you could be waiting hours for some searches to finish. Not great for threat hunting..
With tstats, it’s like having the Disney World fast pass so you skip the line and go straight to the fun. It retrieves data from indexed fields in tsidx files, bypassing the usual event index. This translates to blazing-fast searches, especially for large datasets.
Consider a query like:
| tstats summariesonly=t count from datamodel=Authentication.Authentication where Authentication.action=failure by Authentication.src Authentication.user _time span=1hThis leverages tstats to swiftly count failed authentication events, grouped by source, user, and hourly time spans. It's a potent tool for detecting brute force attacks or anomalous login patterns.
Key benefits of tstats:
Accesses only relevant indexed fields vs entire raw events
Performs aggregations and transformations in memory
Supports efficient searching of high-cardinality data
Accelerated Data Models: Precomputed Power
Accelerated data models take optimization a step further. They are precomputed summaries of event data, refreshed on a schedule. Searches run against these summaries, yielding incredible speed gains.
Imagine investigating a potential malware outbreak. A query like:
| from datamodel:"Endpoint.Processes"
| search "Processes.process"="*maliciousfile.exe*"
| stats count by "Processes.dest" "Processes.user"
This rapidly hunts for a specific malicious process across endpoints by searching the accelerated Endpoint data model. We get near-instant results without combing through mountains of raw process data.
Accelerated data models shine when:
Summarized data suffices vs raw events
Queries involve complex joins or large data volumes
Real-time results are needed for time-sensitive investigations
Putting It All Together
Combining tstats with accelerated data models yields phenomenal performance benefits. By minimizing data scanned and precomputing complex logic, we achieve lightning-fast searches even in massive environments.
Real-world example:
Problem: Detecting credential stuffing attacks
Dataset: 500 GB of authentication logs per day
Original SPL:
index=auth EventCode=4625
| stats count by src_ip, user
Optimized SPL:
| tstats summariesonly=true count from datamodel=Authentication where Authentication.action=failure by Authentication.src, Authentication.userResults:
Original query: 15 minutes
Optimized query: 20 seconds
That's a 45x speed boost - transformative in incident response scenarios where every second counts.
Learn tstats, then use it everywhere you can.
You can thank me later.
Pro Tip: Remember this tstats command layout and you’ll be off to the races - "tstats [count/values/summariesonly] FROM datamodel WHERE constraints BY grouping_fields SPAN timespan". Tstats requires this specific order of parameters for proper functionality.
Bonus: You can convert virtually any search you have into a tstats query. To learn how, check out the following video on YouTube.
Step 5: Translating SPL to Real-World Threat Hunting
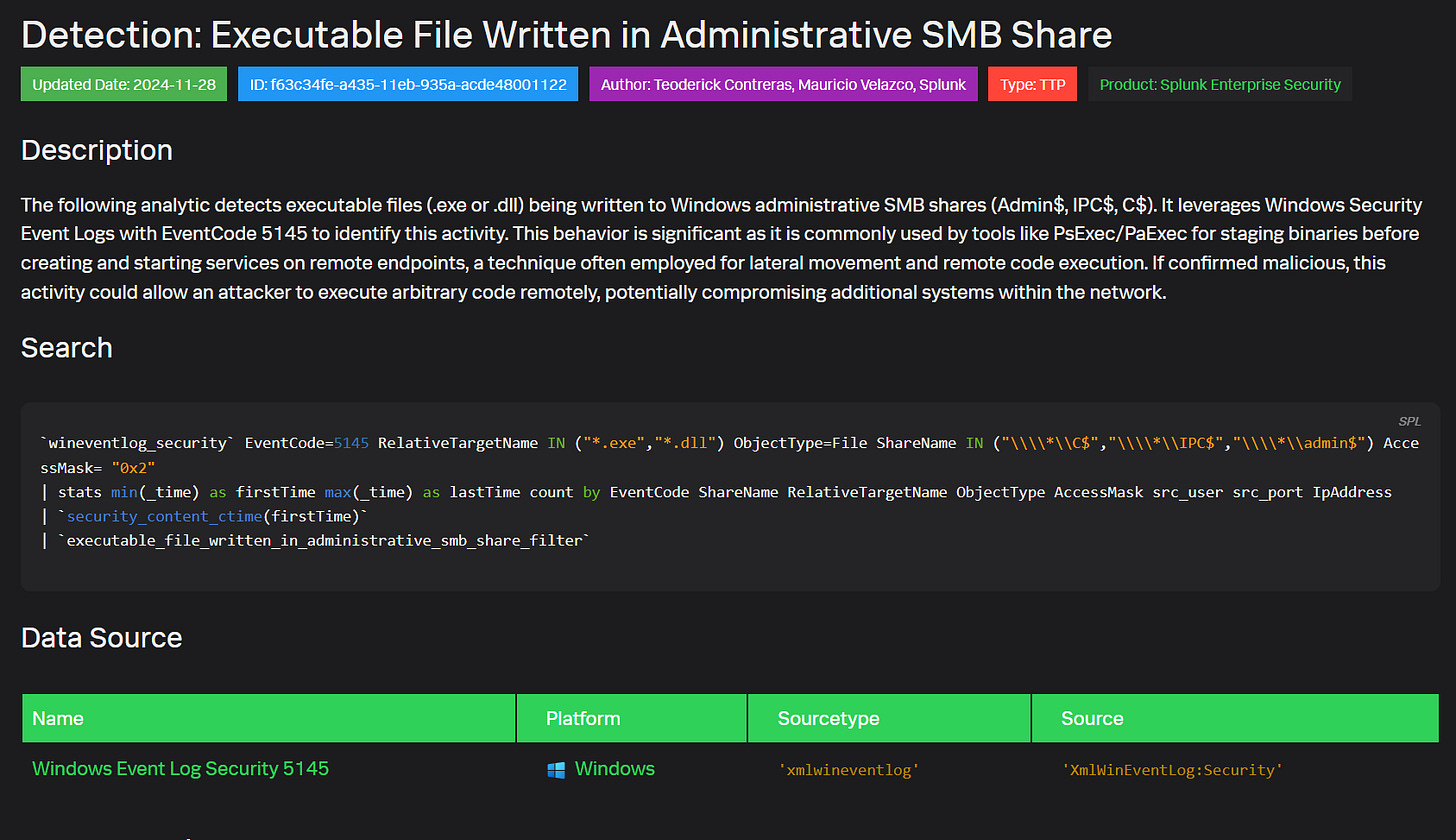
Here's how to leverage pre-built Splunk detection content for detecting potential lateral movement using an analytic focused on executable files written to Windows administrative shares:
The analytic searches Windows Security Event logs for EventCode 5145, indicating a network share object was accessed. It looks for .exe or .dll files written to common admin shares like C$, IPC$, or Admin$. This is significant because tools like PsExec often use these shares to stage executables before creating and starting remote services, a common lateral movement and remote code execution technique.
The SPL query is:
`wineventlog_security` EventCode=5145 RelativeTargetName IN ("*.exe","*.dll") ObjectType=File ShareName IN ("\\\\*\\C$","\\\\*\\IPC$","\\\\*\\admin$") AccessMask= "0x2"
| stats min(_time) as firstTime max(_time) as lastTime count by EventCode ShareName RelativeTargetName ObjectType AccessMask src_user src_port IpAddress | `security_content_ctime(firstTime)`
| `executable_file_written_in_administrative_smb_share_filter`
It searches for EventCode 5145 where the accessed file is an .exe or .dll, the share is an admin share, and write access (0x2) was used.
The stats command summarizes the activity, tracking earliest/latest times, count, and key fields like user, source IP/port, and the specific file and share.
The query leverages the `security_content_ctime` macro to convert the firstTime to a human-readable format and applies a custom filter macro for further refinement.
By alerting on this activity, you can detect potential attacker lateral movement early in the kill chain. Spotting unauthorized writing of executables to admin shares enables proactive response before the adversary can execute code and compromise additional systems. To operationalize this analytic, tailor it to your environment, tune out false positives, and automate it as a scheduled search or real-time alert.
Pro Tip: The above query uses what are called macros, which can store certain search parameters or definitions. While we haven’t covered them in this article, click in the search bar and on the keyboard you can press “CTRL + SHFT + E” to expand them so you can view all of the search logic behind the macros as well.
Step 6: Crafting a Daily SPL Practice Regimen
Consistency is crucial for solidifying skills and achieving mastery.
As I mentioned earlier, my SPL skills didn’t really take off until I decided to start building things and answering my own questions from my AWS infrastructure. It helps to have a reason to care, outside of receiving a paycheck and being a team player on your security team. Deploy Splunk on your own computer if you have to, and start collecting your own computer logs. You might be surprised by what you find. Outside of this, I recommend implementing a daily 30-minute practice routine:
Select a relevant security use case
Construct a foundational query
Refine for better performance and results
Share with the Splunk community for feedback
Remember the driving analogy? Proficiency develops with regular time behind the wheel. Approach your SPL practice with diligence and curiosity.
It could very well lead to that promotion that you’ve been looking for.
Step 7: Tapping into SPL Learning Resources
Unlike back in 2017 when I first started with Splunk, where there were little to no security based searches and content at our disposal.
But today?
There are almost too many.
This is a much better problem to have, however, then virtually no resources at all. Some of my go-to resources include:
Splunk's official documentation (your SPL bible)
Splunk SPL and Regex cheat sheet (your handy desk reference)
Splunk’s security content (Nearly 1800 prebuilt detections to find evil)
Splunk Answers forum (a gathering place for SPL adepts)
Boss of the SOC (BOTS) challenges (SPL gym for flexing your skills)
Splunk Lantern (guidance and documentation from Splunk experts)
Immerse yourself in the wealth of community knowledge - the quickest route to leveling up.
Step 8: Embracing the Mindset of Continuous Improvement
Mastering SPL is an ongoing adventure, not a finite destination.
I still to this day learn something new with SPL, or a better way to craft searches. My best recommendation here is to adopt the mentality of constant growth:
Seek out fresh security challenges to tackle with SPL
Deconstruct queries written by others to expand your toolbox
Contribute your own innovations back to the community
Never stop asking "How could this query be better?"
Expertise is earned through dedicated effort and boundless curiosity. Embrace both and you'll be amazed at your SPL progression.
That's it. Here's what you learned today:
SPL is a pipeline-based language that powers Splunk's security capabilities, allowing you to transform raw data into actionable security insights
Mastering key commands like eval and stats, along with performance optimizers like tstats, forms the foundation of effective threat detection
Building real-world security content requires a blend of SPL knowledge, security expertise, and continuous practice
The difference between reading about SPL and actually using it is like the difference between watching someone drive and getting behind the wheel yourself.
Take what you've learned today and apply it to a real security use case in your environment.
Tell me what you thought of today's email.
Good?
Ok?
Bad? Hit reply and let me know why.
PS...If you're enjoying The Splunk Security Forge, please consider referring this edition to a friend.
Disclaimer: This newsletter is an independent publication and is not affiliated with, endorsed by, or sponsored by Splunk. All opinions and insights are those of the author.


